
Wholesale sourcing notes
A practical guide to using global import and export data for market research
A sound market research workflow turns trade records into a sequence of decisions: define the question, select comparable data, screen candidate markets, validate the strongest signals, and document what the evidence cannot show. Keeping those steps separate prevents a large dataset from creating false certainty.
Key takeaways
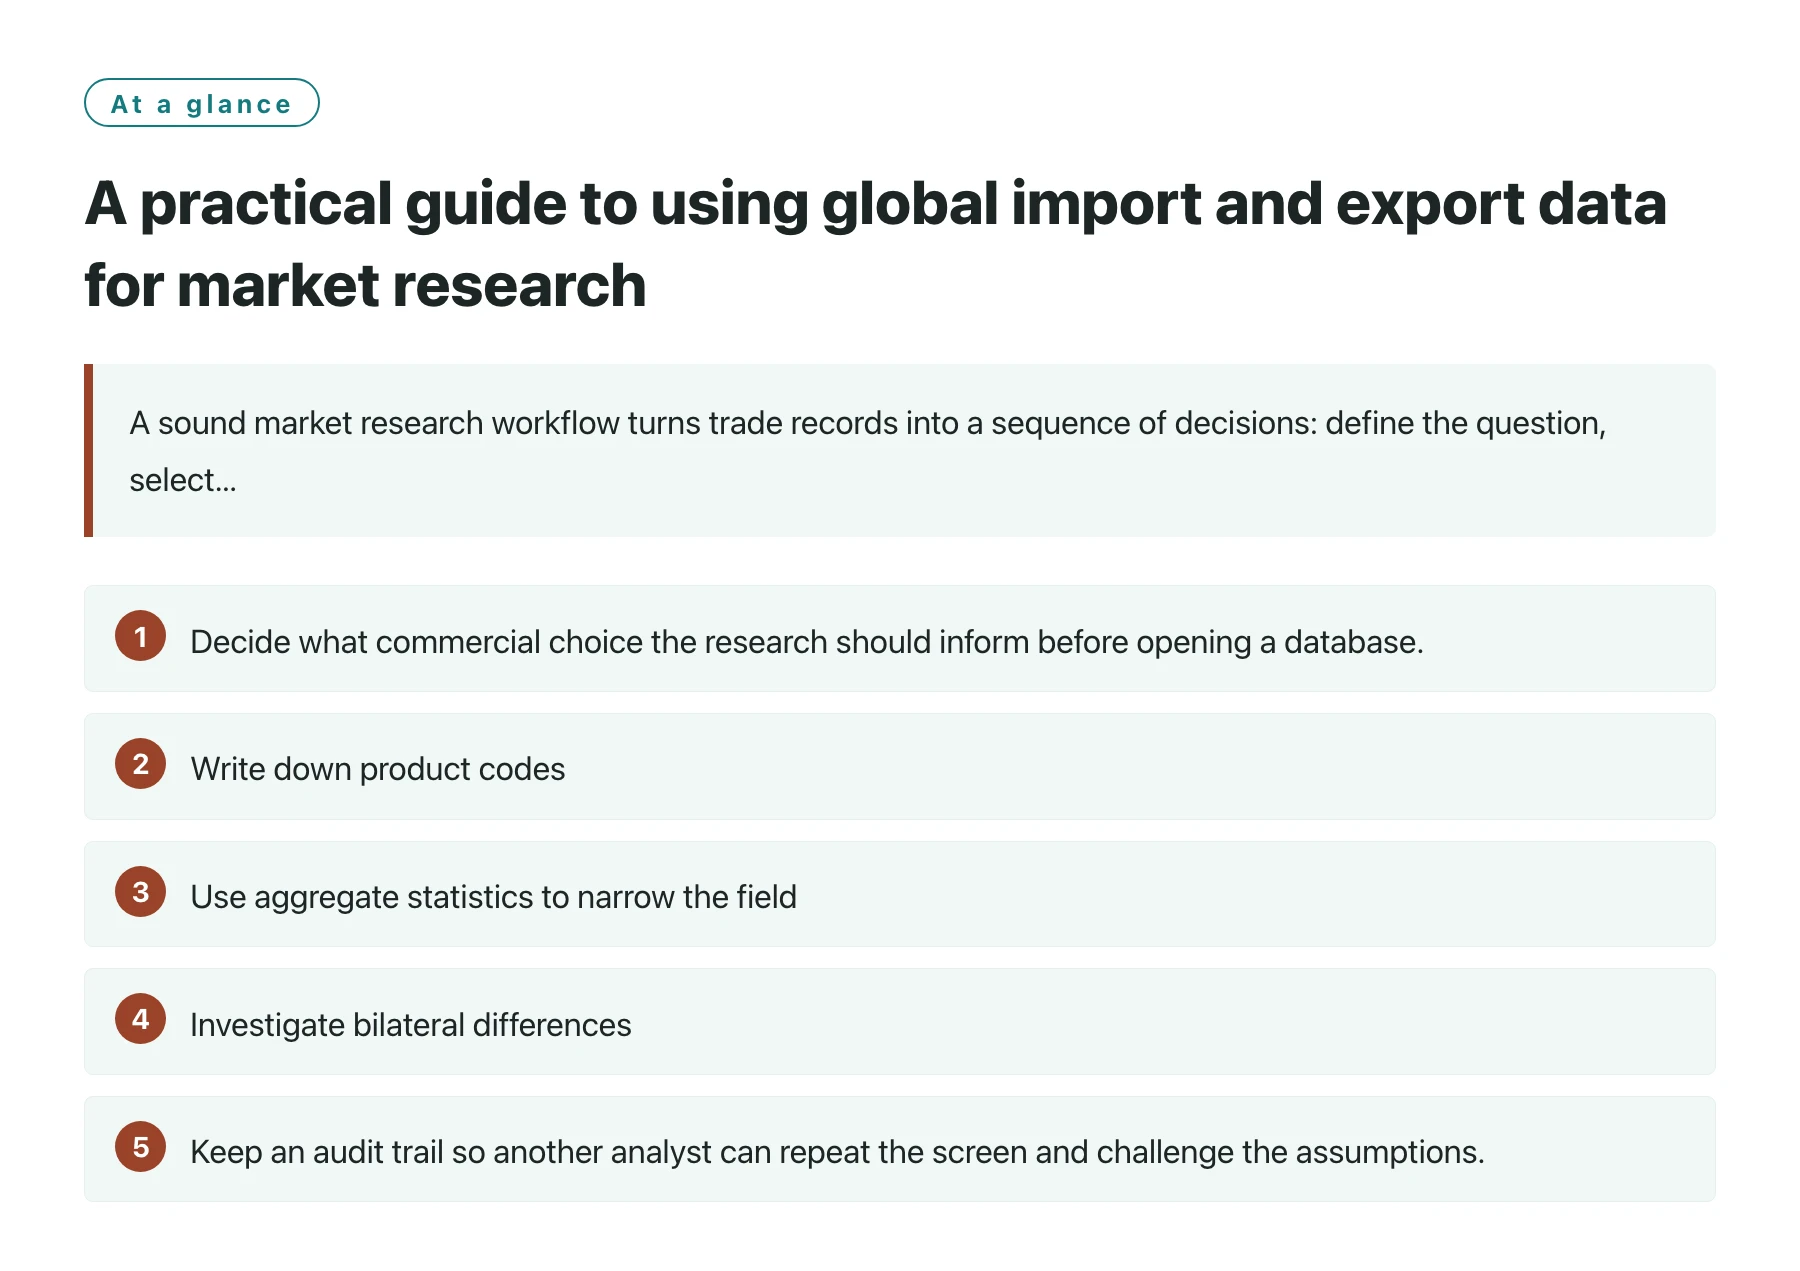
- Decide what commercial choice the research should inform before opening a database.
- Write down product codes, country roles, periods, units, and the source behind every comparison.
- Use aggregate statistics to narrow the field; use company and shipment detail for follow-up, not as proof of demand.
- Investigate bilateral differences, revisions, and coverage before explaining a trend. [1]
- Keep an audit trail so another analyst can repeat the screen and challenge the assumptions.
International trade data can be approached as a workflow rather than a search box. That distinction matters because a search can return many relevant-looking rows without clarifying whether they answer the business question. A workflow defines the question first and gives each dataset a limited role.
The steps below are designed for an analyst comparing export destinations, assessing sourcing options, or preparing a preliminary market-entry brief. They do not replace customer research, tariff review, legal advice, or direct supplier checks. Instead, they help teams decide where those more expensive forms of research are most likely to pay off.
1. Convert the business decision into a research question
Start with the decision owner and the action they may take. A sales leader may need a shortlist of markets for distributor outreach; procurement may need to identify alternative supplier countries; a product manager may want to know whether a category is established or emerging in a destination. These are different questions, so they should not share one undifferentiated query.
Turn the decision into a question with a defined object and boundary. Specify the product family, whether you are looking at imports or exports, the reporter and partner roles, and the period to compare. Add a short note describing what would count as a meaningful signal. That signal might be sustained imports across several periods, a wider set of supplying countries, or a concentration pattern worth investigating. Avoid inventing a threshold after seeing the data.
2. Build a product dictionary before querying
Collect the product’s commercial name, technical terms, common abbreviations, materials, and known substitute descriptions. Then map them to the statistical codes that fit the research geography and period. A single product can be classified differently depending on composition, intended use, processing, or the level of detail in the national tariff schedule. Maintain a crosswalk instead of treating a catalogue label as a code.
The internationally harmonized six-digit structure can help organize cross-country comparisons, while national systems can extend it for tariff and statistical purposes. For United States imports, the official Harmonized Tariff Schedule includes tariff lines and statistical categories and is based on the international Harmonized System. The operative edition and notes still need to be checked for the relevant product and period. [2]
When the classification is uncertain, make the uncertainty visible. Search plausible adjacent codes, read the descriptions and notes, and report a sensitivity range if inclusion choices materially change the market screen. Do not combine categories merely because doing so produces a more impressive figure.
3. Assemble a comparable dataset
Choose the reporter and partner dimensions that match the decision. For import-market screening, imports reported by destination markets may be the natural starting point. For exporter benchmarking, exporter-reported flows can help. Where possible, compare both sides as a consistency check, but do not expect them to match exactly. Timing, valuation, reporting thresholds, coverage, and re-exports may differ.
Before calculating growth or comparing a product with the full import basket, inspect metadata: frequency, currency, quantity unit, valuation basis, trade system, revision status, and classification version. Also note which years have missing observations. A blank or suppressed value is not equivalent to zero. The WTO explains that general and special trade systems differ in how goods moving through customs warehouses and free zones are covered, which can affect the figures used in a comparison. [1]
For a U.S.-specific view, the Census Bureau publishes international trade resources organized by totals, classification, geography, time series, and data products. Its catalog is a useful example of how the same broad subject can be viewed through different dimensions. Select the table that matches your question and retain its record layout or metadata with the extracted values. [3]
4. Screen markets in two passes
- Pass one: broad coverageCompare a stable set of candidate economies and periods using the same product definition. Note total imports or exports, direction of movement, and missingness.
- Pass two: explain the patternFor shortlisted markets, break down relevant partners, products, ports, or companies where the source supports those fields. Ask what changed and whether the result is robust to product-code choices.
- Keep alternative explanations visibleRecord whether a result might reflect re-exports, a reporting revision, unusual shipment timing, or a classification change rather than new underlying demand.
- Choose a validation actionTranslate each promising signal into a check such as reviewing regulations, identifying distributors, or validating named companies through independent sources.
5. Use company-level research to test a market hypothesis
After aggregate data identifies a plausible geography, the next question may be whether relevant firms are active there. Company profiles and shipment records can help organize leads, reveal product descriptions used in records, and suggest relationships to investigate. They are most useful when treated as discovery evidence: a clue that directs further work, not a certificate of commercial fit.
Check whether a company name maps to the correct legal entity, whether the record period is current enough for the decision, and whether the product description is precise enough to support the inference. Similar names, transliteration, subsidiaries, intermediaries, and broad commodity descriptions can all produce false matches. Confirm identity and activity with separate public information before prioritizing outreach.
If the question requires searchable records and buyer-oriented exploration, global buyer data may form part of the research toolkit. Review the platform’s geographic coverage, fields, update cadence, sample outputs, and permitted use before relying on it. A feature list is not a substitute for checking a data sample against a concrete research task.
6. Turn the result into a decision memo
A concise memo should state the question, scope, source, retrieval date, method, findings, and limitations. Include a table of the selected product codes and periods. Separate observed values from interpretations and recommendations. If a result depends on a specific code inclusion or source definition, say so beside the conclusion rather than burying the caveat in an appendix.
For each market, explain why it passed the screen and what evidence is still missing. A market may show substantial import activity but still be unsuitable because of regulation, logistics, competition, cost, or customer access. Conversely, a modest recorded total may hide an attractive niche if the classification is broad or the reporting series is incomplete. Trade data gives structure to the next question; it does not decide the strategy alone.
Close with a specific next action and a review point. For example, ask the team to validate two distributor candidates, compare tariff treatment, or request current customer interviews before committing budget. A clear action keeps the research connected to the decision that motivated it.
Sources
Frequently asked questions
What is the first step in a trade-data market research project?
Define the business decision and the exact product, geography, reporter-partner roles, and period the research must cover.
Can national tariff codes be compared directly across countries?
Not always. Shared international code structure supports comparison, but national extensions and classification revisions can differ. Confirm code descriptions and effective periods.
Are shipment records proof that a named company is a good prospect?
No. They can help identify companies for follow-up, but identity, current activity, purchasing intent, and commercial fit need independent validation.
Why preserve metadata and query details?
They let another analyst reproduce the screen and determine whether differences came from the market or from definitions, coverage, units, revisions, or filters.
Request the sample pack
A paid swatch-and-garment set with a printed evaluation worksheet. Refundable against your first wholesale order.